Thursday, December 28, 2006

Short sell: Federal Express (FDX 107.29) daily momentum hits new lows


Rational: The daily momentum of FDX has hit new lows and appears poised to swing lower from these levels. This chart displays a classic technical pattern, a bearflag, whereby the stock holds temporarily then surges downward another leg. Previous daily support held in the 100's. ADX numbers confirm a downward trending pattern.


Transport stocks has been a source of concern since the Transport averages have diverged lower while the Dow has been hitting new highs. In Dow Theory, this non-confirmation of the Dow Industrials can often have forecasting value signaling intermediate weakening of the overall market.

Target: $100 area
Buy Stop: $109.25

Pre-morning Apple Corp (APPL 80.30) crawling upward to yesterday's high


Continued reports of stock option trouble are still plaguing Apple. As such, investor sentiment has translated the stock into a daily volatile pattern. However, the "value" players are still calling for great fundamentals.
Let the "trend be your friend".

Wednesday, December 27, 2006

Update: FDX breaks higher through $108 price target

After holding support at $106.6, Federal Express (FDX) has surged higher from an oversold daily position.

Short Scalp: Apple Corp (AAPL 79.04) : Pre-morning downside action


AAPL pre-morning (1 min) action suggest lower prices to daily chart support at the 77.7 level. Here a previous gap is present and base building area..

Tuesday, December 26, 2006

Post- holiday market internals suggest upward bias as Feb. '07 crude oil plummets


Market internals suggest an upward bias in the post- holiday session especially in light of crude oil plummeting mid-morning regarding warm weather forecasts. Also, Iran vowed to defy UN sanctions on its nuclear research. Retail and oil names have been dropping while banks, materials, semi's, and trucking have stayed in positive territory. However, intermediate-term daily forecasts have been increasing for some sort of correction. Market indicators displaying corrective signals include:

1) extreme bullish sentiment (Investor Intelligence)
2) lower VIX numbers & lower daily put/call ratios
3) diverging daily New high/low indicies
4) diverging Transports Avgs. compared to Dow new highs

Adv/Dec & Up/Down ratios: 1.90, 2.13

TRIN: .90 falling

Sector Update:
Strong: REITs, semiconductor equipment, gold, diversified metals & mining, construction materials, fertilizers & chemicals

Weak: drillers, drug retail, oil & gas storage, computer & electronics retail, apparel retail, dept stores, oil & gas equipment, apparel & accessories, internet retail, general merchandise

Buy: (OIH) Oil Service (60 min) upside momentum divergence


Rational: The 60 min chart on (OIH 142.47) is diverging higher (MACD) while RSI (see chart) is rising from oversold levels.

Target: 145.08 lower resistance of prior trading range

Stop: 140.95 todays support level

Short Scalp: China Life Insurance (LFC) overbought with declining (60 min) momentum


Rationale: China Life Insurance (LFC 129.75) has an very extended pattern and suggests on the 60 min chart to display diverging momentum (MACD) and RSI. ADX numbers also have reached soaring levels. Watch for one more push up to test previous 130.93 high, then a potential break to the 60 min ema (123.36)
Target : 60 ema ( 123.36)

Stop: (131.25) above daily high


Friday, December 22, 2006

Overnight Buy Scalp: Federal Express (FDX) suggests a short-term bottom


Rationale: FDX has been strongly selling off this week due to profit-taking and earnings sentiment. On the 30 min chart, the technicals are suggesting a short-term bounce up to the 30 min EMA (108.16). Momentum (30 min MACD) is diverging higher while ADX numbers appear to have peaked. Also, daily RSI numbers are very oversold.


Target: 108.16 (30 min EMA)
Stop: 106.50 (below today's low)

Pre-morning Buy Scalp: Red Hat (RHT) reports 3rd qtr. lower earnings but beats expectations


Thursday, December 21, 2006

Update: Retail stocks contrast fundamental upside vs. eroding technical patterns


Rationale: One key observation has been the contrast between continued fundamental upside support for retail names as technical patterns have suggested quite the contrary. As we mentioned in previous updates, retail names are suspect as price patterns continue to head lower. The Kohl's (KSS) chart above is heading lower to daily support levels. This type of price action suggests a potential breakdown with lower prices to occur. Other similar charts include: TGT, TJX, AEOS, YUM.

Pre-morning Buy Scalp: Syneron Medical (ELOS)


Buy: @ 27.49
Stop: 27.12

Wednesday, December 20, 2006

Large Cap (S&P) vs. Small Cap (Russell) shift


The Large Cap/Small Cap ratio at the bottom of this chart (see rectangle area) appears to be stabilizing in the 2006 4th quarter.

Money managers have been calling for a shift to large cap stocks for 2007.


Update: Lehman's Bros.(LEH 77.85) technical pattern is breaking higher

Lehman's Bros.(LEH) technical pattern is breaking higher and appears poised to test it's previous highs (79.89). Since Oct '06, Lehman Bros. has developed a strong base-building pattern and recently reported strong earnings growth.

Update: Triad Hospitals (TRI) appears poised to re-test recent highs

Triad Hospitals (TRI) price pattern is breaking higher from its recent daily pullback and appears poised to re-test its previous high of $42.65. Secondly, (TRI) stock has been actively accumulated (13D) by an active investor group regarding valuation.

Pre-morning short scalp : FedEx (FDX): reports solid earnings


Tuesday, December 19, 2006

Jan '07 Crude Oil is approaching the magic point


Rationale: Once again, crude oil is recovering mid-day, quickly approaching the magical "technical" resistance price point of $63.82 area. Consequently, oil shares have rallied back pushing market internals back to neutral after the early morning market crush. This chart suggests a gradual bias upward in momentum accompanied by a classic base -building price pattern. With today's PPI surge and tomorrow's Crude Inventory report (Dec. 20th 10:30am), watch for upside sentiment.

The Bottom Line: Expect higher crude prices.

Update: Brink's (BCO) is breaking lower

(BCO) has reached it's 30 min EMA (62.90). Cover 1/2 position.

Monday, December 18, 2006

Overnight Short Scalp: Brink's (BCO) 13d news


Rationale: While the daily trend looks strong, the 60 min chart looks poised to pullback from these levels. Momentum is overbought while ADX levels appear excessive. Strong active investor interest regarding undervaluation has pushed the stock higher.

Entry: Short @ current levels
Target: 61.39 60 min EMA
Stop: 64.60 today's high

Update: Watch List: selected retail names could "trip" after holiday period

As selected retail names have transitioned to consolidation patterns, watch for continued signs of technical breakdowns among this group. (Note: BBY has broken lower from current levels.).

Market internals essentially flat while M&A activity prevails


Despite M&A activity in the gaming area and large cap stock runups, internals are edging into negative territory. Oil names are pausing as crude oil prices have eased followed by selloffs in basic materials, railroads and trucking.

Market TICKS are still an inside day while up/down volume is essentially flat(see above chart).

Adv/Decl & Up/Dwn Ratios: .84, .89
TRIN: .92 falling

Sector Update:
Strong: healthcare services, casinos, industrial conglomerates, semi equipment, telecom equipment
Weak: tires & rubber, steel, oil services, oil drilling, aluminum, gas utilities, oil refining, oil & gas exploration

Update: Google (Goog) Daily chart losing momentum


Google appears poised for a breakdown just holding support at (477) even though large cap stocks are greatly in favor. Today an interesting WSJ article highlighted possible earnings concerns. Although, GOOG hit a high of $513/share, current technicals suggest lower prices.

Buy scalp : 5 min (JOYG) pre-morning action strongly higher on surprise earnings announcement


Joy Global Inc. (JOYG) reports Q4 EPS of $0.71, 5 cents better than estimates. Revenues were $689 million vs. $655.64 million consensus.The outlook for the majority of the company's markets remains strong as increasing demand for coal, copper, iron ore and oil reflects global economic growth.

Applebee's (APPB) up in pre-morning action

(APPB) was upgraded this morning by UBS from Neutral to Buy. It has also been the subject of an investor group, Breeden Capital, 13D filing regarding "Applebee's poor total return performance compared to industry peers."

Conservative Long-term Buy: Citibank (C 54.70)


Rationale: Citibank (C) has officially been the talk of undervaluation compared to industry peers. Management shuffling plus talk of breakup rumors have pushed the stock higher from its yearly consolidation range. A Merrill Lynch upgrade of Citigroup (C) to Buy from Neutral is also out. In recent years, (C) has been a poor relative price performer. Now, technicals support higher prices with new momentum highs and stronger relative strength.
Entry: Price pullbacks on 60 min charts @ 20 period EMA (53.18)
Stop: $50.38 daily support base

Sunday, December 17, 2006

Long-term Buy: General Electric (GE 37.36)


Rationale: GE has been breaking higher from it's 4th quarter trading range. Technicals support higher prices with high ADX numbers and new momentum highs. Secondly, a strong shift to large cap stocks is once again in vogue among money managers.

Entry: 30 min chart, pullback @ 20 period EMA
Stop: $35 daily support base

Friday, December 15, 2006

Intraday market internals suggest continued consolidation into Monday's session


After a raft of stellar broker earnings, steady interest rate policy, rising crude oil prices, and diplomatic China trade talks this week, today's market action suggests continued consolidation as institutions and individual investors absorb bullish sentiment. Also, continued notions prevail that the market is overbought on a short-term basis but a exodus of participants before the Christmas holiday is generally expected.

Both Advance/Decline and Up/Down volume ratios are holding steady at 1:1 while TRIN is ranging in the .84 area. Intraday breath (top chart, see falling red line) continues lower from yesterday's strong market action as market TICKS (top chart, see bottom panel) has spent most of the time in positive territory. The market has trended quite orderly as market sensitivity has been soothed by alignment between Fed rate expectations and actual economic reports.

One area of concern among insiders is nagging over-bullish sentiment as displayed by lower put/call ratios, a lowering VIX number, and bullish/bearish sentiment extremes as displayed by Investors Intelligence. Lower volatility as expressed by the VIX often correlates with market peaks.


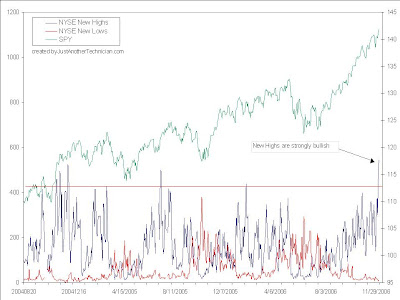
Longer-term, bullish market action continues to be supported by new highs in stocks (see chart above) and strong market breath. This chart displays the recent peak in new New Highs. However, note the gradual divergences that emerge as market action gently diminishes after new high peaks have been reached.

Thursday, December 14, 2006

Regional Bank ETF (RKH) hits new momentum highs

The Regional Bank ETF (RKH) is breaking higher from its recent consolidation period buoyed by merger news and continued institutional rotation towards the financial sector. Momentum temporarily dipped in early December '06 only to resume its strong upward trend to new highs. Financial names that make up this ETF include: BBT, CMA, MEL, STI, MI.

Buy scalp : 5 min (OIH) suggest upward trend with Jan '07 Crude oil higher


The OIH 5 min chart suggests upside prices at these levels.
New MACD momentum highs plus >30 ADX numbers argue a higher trend. (Note: the buy point (see green circle) in MACD)

Target: 151.35 todays previous high
Stop loss: 148.96 15 min (20 period) ema

Morning market internals screaming higher, breath numbers +1525


Morning market internals are strongly higher with breath numbers hitting +1525.

Adv/Dec and & Up/Down ratios: 3:18, 5.12 and rising
TRIN: .59 falling

Across the board is bullish optimism with a slew of earning upsides from Bear Stearns (BSC) and Lehman (LEH) with oil stocks betting on OPEC future cuts in production. Jan '07 Crude Oil contract is up +.71 while oils names have risen from the open. Weekly jobless claims dropped by 20,000, pushing the four-week moving average of new claims down 1,500 to 327,250, according to government data.

Sector Update:

Strong: Semis, Oil Equipment, Software, Hotels, Retail - Apparel, Toys, Gambling, Medical Equip

Weak: Airlines, Aerospace

Jan '07 Crude Oil (+.94) blast higher awaiting OPEC meeting


Wednesday, December 13, 2006

Applebee's (APPB) stock moves higher after Breeden Capital cites poor performance

Applebee's technical price pattern edged higher today after active investor Breeden Capital yesterday cited Applebee's poor total return performance compared to industry peers. Streetinsider 13D Tracker notes " in a letter to the Applebee's directors that, over the three years ended December 1, 2006, Applebee's total return to shareholders was 13th worst out of 14 comparable companies. " Breeden Capital (founded by former SEC Chairman Richard C. Breeden) is a 5.25% holder of Applebee's stock. (Note: Price moves in equities can precede 13d disclosure filings.)

Oil ETF (OIH 147.65 +1.83) testing range highs after release of bullish EIA oil inventories number


The Oil Holdrs ETF (OIH) is testing range highs after EIA oil supply inventory numbers were released at 10:30 am. Additionally, the Jan '07 Crude Oil contract has surged higher in mid-day session approaching yesterday's high of $62.01.

Buy: Yum Brands (YUM): FDA and CDC fail to find E. coli in green onions

After a four day selloff on Yum Brands (YUM), the FDA and CDC fail to find E. coli in green onions. As reported from Marketwatch.com "Doctors for the Food and Drug Administration and Centers for Disease Control and Prevention said late Monday they have been unable to confirm preliminary reports of E. coli in green onions at Taco Bell, reports that have been linked to dozens of illnesses in the Northeast and elsewhere. "

RIMM: Overnight Buy Scalp higher in pre-morning activity


Tuesday, December 12, 2006

Overnight Buy Scalp : RIMM : buy divergence developing


A buy divergence (see MACD rising) suggest higher prices for 30 min RIMM chart.

Also, market TICKS have reversed into positive
territory within the last hour of the day.

Target: 30 min EMA (20 period) (126.01)
Stop Loss: 124.25

Selected retail names (KSS, TGT, TJX, AEOS, YUM) technically suggest lower prices


Selected retail names, longer-term, appear toppy and could head lower breaking key technical support levels.


Kohl's (KSS) appears to be headed toward a key technical support level (see horizontal line) displaying a classic "head and shoulders" pattern.


TJX Cos. (TJX): Broke from its late Nov. '06 highs and has since formed a bear flag pattern, today breaking lower to re-test support at $26.50 area.
American Eagle (AEOS): Early stage toppy pattern and could test its $44 support area.

Yum Brands (YUM): Currently racked by bad fundamental news, is testing the $58.50 area.

Other retail names that have displayed downward price action : ANN, ANF, WMT, FD, BBY

Market internals heading negative prior to FOMC announcement


Investor uncertainly and disappointed bullish sentiment are racking the markets pulling airlines, retail, steel names downward while oil and oil names edge higher on anticipated OPEC cuts. Ticks had held in the positive range but have pierced the lower (-600) boundry. SPY's are close to testing Friday's lows @ 140.78. Nucor (NUE 59.60 -4.75) said it sees Q4 earnings well below Wall Street forecasts. Goldman Sachs (GS 201.97 -0.55) seriously topped Wall Street estimates. Best Buy (BBY 50.83 -3.08) missed analysts' expectations.

Adv/Dec & Up/down ratios : 1.9 , 2.62
TRIN: 1.36

Sector Update:
Strong: drillers, food retail, specialty REITs, oil & gas equipment, oil & gas storage, integrated oil, office eletronics, health care supplies

Weak: steel, auto equipment, aluminum, tires & rubber, coal & consumable fuel, dept stores, computer & electronics retail

Jan '07 Crude Oil contract looks poised to re-test previous highs


The Jan '07 Crude contract looks poised to re-test "technical" resistance @ 63.77 levels. New price momentum as noted by the early December MACD peak have created a setup (see circle) in the form of a mild pullback in price. With current low ADX levels, expect some form of price expansion. In turn, expect oil stocks to rally in kind. Short-term key fundamentals drivers include: 1) seasonal warm weather forecasts 2) anticipated OPEC forecast cuts 3) Crude oil inventory supply numbers due tomorrow (Wednesday 10:30 am).

Short Scalp: Best Buy (BBY) Pre-morning action regarding earnings announcements


A short scalp was intiated @ 51.14 on Best Buy (BBY) regarding pre-morning earnings announcements.

Monday, December 11, 2006

Reminder: FOMC rate announcement Tuesday Dec. 12th 2:15 pm

Buy scalp: Continental (CAL) is close to re-test of previous highs


Bullish analyst comments helped send shares of airline stocks higher including Continental(CAL). CAL is trending upward on the 15 min chart (see chart) with new momentum highs (see MACD spike) and strong ADX(30)numbers. The daily chart has broken higher from a base that held support along the 20 day EMA.

Phlx Banking Index ($BKX) is breaking higher from consolidation


The Phlx Banking Index ($BKX) is breaking higher after consolidating since Oct '06. Mergers news and industry consolidation has dominated the banking arena. Mellon Financial(MEL) and Bank of New York (BK) announced a merger last week. Core banking stocks that are technically poised to move higher include: C, JPM, CMA, and BBT.

Update: Federal Realty (FRT) short continues lower (+ 1.87 gain)

Sell short recommendation dated December 6th on Federal Realty continues lower after indicating daily sell divergences.

Re-iterate Buy : NYSE Group (NYSE)


NYSE Group (NYX) has held support in the $95 range and is breaking higher intraday as shown on this 60 min chart. Merger talks continue regarding NYSE Group's planned merger with Euronext (an European stock exchange operator while Intercontinental Exchange (ICE) continues its buyout of NYBOT despite a lawsuit by some of its members.

Upgrade: Claire's Stores (CLE) is up +1.52 pre-morning on upgrade by Brean Murray from Sell to Hold

Pre-morning Intercontinental (ICE) is trending higher


Pre-morning Intercontinental Exchange (ICE) is up strongly. A deal is currently in motion for NYBOT to be bought out by Intercontinental Exchange (ICE).

Friday, December 8, 2006

Market internals quickly improving (SPY 141.83 + .67)


Market internals are improving despite the morning confusion about employment economic reports. A rising Nov. nonfarm payroll report seems to lend more support for a soft landing. Also, a spiking Dow component Citigroup (C 52.48 +1.80) is breaking above its previous 52-week high supporting the S&P.

Advance/Decline & Up/Down Ratios: 1.48, 1.48

TRIN: .99 falling

Sector update:

Strong: investment banks, computer & electronics retail, coal & consumable fuel, drillers, construction & farming, paper packaging, education svcs, airlines, industrial machinery

Weak: independent power producers, specialty consulting svcs, wireless svcs, home entertainment software, trucking, health care distributors, homebuilding, explorers, brewers

Update: Cover Short at current levels: RIMM rebounding on diverging momentum

RIMM (126.88) appears to be diverging higher on the 15 min time frame. A short recommendation was issued December 7th . The ADX (63.67) has reached an upper inflection point while the rising 15 min MACD has developed a higher low. Expect price resistance at the 15 min (20 period) EMA (128.68).

Update: Short: Federal Realty (FRT) is heading lower


Federal Realty (FRT) continues lower due to over-extended price action, diverging daily RSI and declining momentum. A previous short recommendation was issued dated December 6th for (FRT).

Short Scalp: Websense (WBSN) downgraded by Cowen & Co.


Websense (WBSN) 23.65 was downgraded by
Cowen & Co. to Underperform from Neutral.
A short was initiated @ 23.91.
Price target : 22.90 Daily chart support area
Stop loss : 24.22 todays high

Update: Spec Buy Barclays (BCS) approaching pre-morning highs


Speculative Buy: Barclays (BCS) up on potential buyout news


Bank of America (BAC) is "very interested" in buying Barclays (BCS) according to a Merrill Lynch analyst.

This chart shows the pre-morning action of BCS.

As quoted from the analyst, "Bank of America has previously indicated that the next phase of its expansion is to become a leading global commercial and investment bank. In order to achieve that goal, we believe Bank of America is very interested in acquiring Barclays," the broker said in a note to clients. "

Thursday, December 7, 2006

Update: Steel stocks remain strong despite overbought market concerns


US Steel (X) remains strongly in a uptrend. In our initial Buy recommendation dated November 29th, X had pulled back from a breakout of a two month base. Now it has continued its upward trend breaking its old April '06 high of $77.77. Expect a mild pullback as the market prepares for next week's Dec. 12th FOMC meeting. Other steel names and related metal names approaching new highs and trending higher include : AKS, CLF, OS, NUE, ATI, PCU.

Update: Short Scalp: RIMM (129.86) Look to cover 1/2 of position

As RIMM falls lower, look to cover 1/2 of position at these levels due to decreasing momentum as noted in the 15 min chart. The MACD indicator made its first momentum low and has now rallied higher (red eclipse) while prices have reached newer lows. Now a temporary but phantom buy divergence has occurred. From here expect the MACD to drop with a higher low while the slower(red line) slowly works its way higher.


In layman terms, as prices reach extreme levels, momentum begins to decrease, as exhibited by the rising MACD indicator, predicting a reversal of some sort.

Morning market internals remain mixed


Morning market internals remained mixed with weakness in the oil, builder, software, auto, and biotech areas.


A/D and Up/Dwn ratios are on the downside at: 1.25 , 1.34

TRIN: 1.07 rising

Sector Watch:

Strong: steel, managed health, apparel retail, thrifts & mortgage, gold, health care supplies, tobacco

Weak: homebuilding, forest products, computer & electronics retail, autos, biotech, coal & consumable fuel, internet retail, oil service

Short Scalp: Research in Motion (RIMM 130.25) exhibiting sell divergences

While there is no doubt that RIMM's long-term trend has remained strong, the short-term momentum has diminished. The daily momentum indicators have been signaling sell divergences and overbought status. A short was initiated this morning @ $131.47. Price target 120.50 previous breakout support area. Stop 133.25.

(Because RIMM carries a wide daily ATR, a wider stop has been issued. )

Wednesday, December 6, 2006

Update: Re-iterate BUY: Oil Service ETF (OIH 148.15) is breaking higher from range bound action


The oil service stocks are rallying higher. In my previous Buy recommendation (dated Nov 28th), a buy stop was placed @ 141.07. Since that time, the Jan '07 Crude Oil contract has been climbing higher from its bottoming action lifting the oil service names including the OIH ETF(148.15).

Mid-day market internals are grinding to a stalemate

After two days of strong upside market action, intraday market internals appear to be slowing to a mixed day. Advance/Decline and Up/Down volume ratios are flat at .91, 1.11, respectively, while TRIN has settled in the .85 range.


However, daily market internals remain strongly bullish. Daily NYSE new highs on Tuesday hit 547, a new high, while new lows were a mere 12. Cumulative breadth has also maintained strong confirmation of a continued uptrend in the markets.

Sector Update:
Strong: homebuilding, steel, drug retail, paper products, building products, construction, forest products, motorcycles, home furniture
Weak: diversified REITs, retail REITs, railroads, autos, systems software, personal products, fertilizers & chemicals, agricultural products

Buy: Lehman Bros. (LEH) daily chart holding support


Lehman Bros (LEH) has been holding support in the $71 range after reaching Oct '06 highs in the $78 range. Now the stock has rallied the last two days and appears to be poised to at least re-test the Oct. high of $78.89. Other brokerage names with bullish technical patterns include: GS, BSC, MS.